
Services / Profitability
Know exactly where you make money and where you lose it.
AI agents reconstruct your P&L at the SKU level, track fee changes over time, and surface margin trends so your Brand Manager can protect profitability instead of guessing at it.
Free Listing Audit
SKU-Level Profitability
Know exactly which products make money and which erode profit, down to fees, ads, COGS, and returns.
Trends Caught Early
Fee changes, cost increases, and profitability erosion surfaced before they compound.
Decisions, Not Just Reports
Every margin insight comes with context your Brand Manager can act on.

See what Lumian sees
Paste any ASIN. Our AI audits your listing in real time. No sign up required.
Titles, bullets, images, backend search terms, A9 indexing, Cosmo readiness, and Rufus optimization.
capabilities
Full scope of what Profitability covers.
P&L reconstruction, SKU-level margin analysis, fee reconciliation, and margin modeling.
Know Your Numbers
/
P&L Reconstruction
Full P&L Assembly: Revenue, fees, COGS, advertising, and net profit consolidated from Amazon reports, advertising console, and your cost data into one complete financial view.
Settlement Reconciliation: P&L reconciled against Amazon settlement reports to ensure every line item is accounted for.
Time-Series Tracking: P&L compared across custom time periods to spot fee increases, margin compression, and profitability trends early.

Key Metrics
Done
P&L Reports
View Reports
Reconciliation Done
Know What's Profitable
/
SKU-Level Profitability
SKU-Level P&L: True profitability calculated per product after all fees, ads, COGS, and returns are factored in.
Margin Driver Analysis: Products ranked by their contribution to total margin, surfacing the top performers and the bottom drags.
Per-SKU Action Plans: Each SKU tagged with a recommended action based on margin profile.

Ahoy Matey
United States
P&L comparison
Jan 2026
FEB 2026
Jan 2026
Analysis
Done
Fee
20 %
Margin Compression
5 %
Profitability
12 %
Contextualize changes
Done
Model What's Next
/
Margin Modeling
Scenario Planning: Profitability modeled for new products, fulfillment shifts (FBM to FBA, 1P to 3P), fee structure changes, and dimensional updates before committing.
Ad Spend & Margin Analysis: Variable advertising spend mapped against SKU-level margins to isolate where ad dollars protect profit and where they erode it.
Revenue & Profit Projections: Forward-looking margin projections modeled across growth scenarios, pricing changes, and cost shifts.

Scenario Planning
Done
Fulfillment Shifts
Fee Structure Changes
Dimensional Updates
Advertising Spend
SKU-level margins
Ahoy Matey
United States
Revenue Projections
Protect Your Margins
/
Fee Reconciliation
Fee Validation: Category, referral, and dimensional fees reviewed against expected rates to catch overcharges.
Chargeback & Dispute Filing: Incorrect chargebacks, fulfillment fee errors, and inbound receiving discrepancies identified and disputed.
Account-Level Reconciliation: All fees, adjustments, and reimbursements monitored and reconciled.
Current Fees
Category
$XXX
Referral
$XXX
Expected Fees
Category
$XXX
Referral
$XXX
Chargeback & Dispute
Done
Chargebacks
Incorrect
Fulfillment Fee
Error
Inbound Receiving
Error
Reconciliation
Done
How Profitability runs at Lumian.
AI tracks margins and flags shifts. Your finance team validates and models. Your Brand Manager recommends and acts. You make informed decisions on margin.
Book a Strategy Call
ALWAYS ON
Fee Monitoring
Fees audited against expected rates, chargebacks and discrepancies flagged, reimbursements tracked.
daily case
P&L & SKU Profitability Review
Full P&L reviewed, per-SKU margins analyzed, top performers and bottom drags identified. Margin trends, fee changes, and cost shifts presented.

Marcus Liu
Content Specialist
on demand
Margin Modeling
Scenario analysis for new products, fulfillment shifts, pricing changes, and ad spend impact run whenever strategic decisions need backing.

Marc Raymonds
Brand Manger
AI Agent

How Profitability runs at Lumian.
AI agents analyze margins and flag profitability changes.
AI agents reconstruct your P&L, track fee changes across the catalog and over time, identify SKUs where margin is compressing, flag profitability trends, and monitor thresholds continuously.
01 — AI Layer

AI Agent
AI Agent
Lumian’s AI Agents
01 - AI Layer
02 - Specialist team
03 - Brand Manager
04 - Client

The onboarding journey
Amazon, finally off your plate.
Common questions
Everything you want to know before the call.
What does Lumian's Profitability service cover?
P&L reconstruction, SKU-level margin analysis, fee reconciliation, and margin modeling, managed by AI agents and our finance team, overseen by your Brand Manager. Every insight is designed to inform decisions on pricing, advertising, inventory, and which SKUs to invest in or phase out.
Can Lumian identify Amazon fees that are hurting margin?
Can Lumian show which SKUs are driving profit and which are not?
Do you reconcile against Amazon settlement reports?
How does Lumian track profitability over time?
Who interprets the financial data and recommends actions?

AI Agent
Your Amazon business, fully managed.
Brand ManAger

Expert Team

Services / Profitability
Know exactly where you make money and where you lose it.
AI agents reconstruct your P&L at the SKU level, track fee changes over time, and surface margin trends so your Brand Manager can protect profitability instead of guessing at it.
Free Listing Audit
SKU-Level Profitability
Know exactly which products make money and which erode profit, down to fees, ads, COGS, and returns.
Trends Caught Early
Fee changes, cost increases, and profitability erosion surfaced before they compound.
Decisions, Not Just Reports
Every margin insight comes with context your Brand Manager can act on.
See what Lumian sees
Paste any ASIN. Our AI audits your listing in real time. No sign up required.
Titles, bullets, images, backend search terms, A9 indexing, Cosmo readiness, and Rufus optimization.
capabilities
Full scope of what Profitability covers.
P&L reconstruction, SKU-level margin analysis, fee reconciliation, and margin modeling.
Know Your Numbers
/
P&L Reconstruction
Full P&L Assembly: Revenue, fees, COGS, advertising, and net profit consolidated from Amazon reports, advertising console, and your cost data into one complete financial view.
Settlement Reconciliation: P&L reconciled against Amazon settlement reports to ensure every line item is accounted for.
Time-Series Tracking: P&L compared across custom time periods to spot fee increases, margin compression, and profitability trends early.
Key Metrics
Done
P&L Reports
View Reports
Reconciliation Done
Know What's Profitable
/
SKU-Level Profitability
SKU-Level P&L: True profitability calculated per product after all fees, ads, COGS, and returns are factored in.
Margin Driver Analysis: Products ranked by their contribution to total margin, surfacing the top performers and the bottom drags.
Per-SKU Action Plans: Each SKU tagged with a recommended action based on margin profile.
Ahoy Matey
United States
P&L comparison
Jan 2026
FEB 2026
Jan 2026
Analysis
Done
Fee
20 %
Margin Compression
5 %
Profitability
12 %
Contextualize changes
Done
Model What's Next
/
Margin Modeling
Scenario Planning: Profitability modeled for new products, fulfillment shifts (FBM to FBA, 1P to 3P), fee structure changes, and dimensional updates before committing.
Ad Spend & Margin Analysis: Variable advertising spend mapped against SKU-level margins to isolate where ad dollars protect profit and where they erode it.
Revenue & Profit Projections: Forward-looking margin projections modeled across growth scenarios, pricing changes, and cost shifts.
Scenario Planning
Done
Fulfillment Shifts
Fee Structure Changes
Dimensional Updates
Advertising Spend
SKU-level margins
Ahoy Matey
United States
Revenue Projections
Protect Your Margins
/
Fee Reconciliation
Fee Validation: Category, referral, and dimensional fees reviewed against expected rates to catch overcharges.
Chargeback & Dispute Filing: Incorrect chargebacks, fulfillment fee errors, and inbound receiving discrepancies identified and disputed.
Account-Level Reconciliation: All fees, adjustments, and reimbursements monitored and reconciled.
Current Fees
Category
$XXX
Referral
$XXX
Expected Fees
Category
$XXX
Referral
$XXX
Chargeback & Dispute
Done
Chargebacks
Incorrect
Fulfillment Fee
Error
Inbound Receiving
Error
Reconciliation
Done
How Profitability runs at Lumian.
AI tracks margins and flags shifts. Your finance team validates and models. Your Brand Manager recommends and acts. You make informed decisions on margin.
Book a Strategy Call
ALWAYS ON
Fee Monitoring
Fees audited against expected rates, chargebacks and discrepancies flagged, reimbursements tracked.
daily case
P&L & SKU Profitability Review
Full P&L reviewed, per-SKU margins analyzed, top performers and bottom drags identified. Margin trends, fee changes, and cost shifts presented.
Marcus Liu
Content Specialist
on demand
Margin Modeling
Scenario analysis for new products, fulfillment shifts, pricing changes, and ad spend impact run whenever strategic decisions need backing.
Marc Raymonds
Brand Manger
AI Agent
How Profitability runs at Lumian.
AI agents analyze margins and flag profitability changes.
AI agents reconstruct your P&L, track fee changes across the catalog and over time, identify SKUs where margin is compressing, flag profitability trends, and monitor thresholds continuously.
01 — AI Layer
AI Agent
AI Agent
Lumian’s AI Agents
01 - AI Layer
02 - Specialist team
03 - Brand Manager
04 - Client
The onboarding journey
Amazon, finally off your plate.
Common questions
Everything you want to know before the call.
What does Lumian's Profitability service cover?
P&L reconstruction, SKU-level margin analysis, fee reconciliation, and margin modeling, managed by AI agents and our finance team, overseen by your Brand Manager. Every insight is designed to inform decisions on pricing, advertising, inventory, and which SKUs to invest in or phase out.
Can Lumian identify Amazon fees that are hurting margin?
Can Lumian show which SKUs are driving profit and which are not?
Do you reconcile against Amazon settlement reports?
How does Lumian track profitability over time?
Who interprets the financial data and recommends actions?
AI Agent
Your Amazon business, fully managed.
Brand ManAger
Expert Team
Services / Profitability
Know exactly where you make money and where you lose it.
AI agents reconstruct your P&L at the SKU level, track fee changes over time, and surface margin trends so your Brand Manager can protect profitability instead of guessing at it.
Free Listing Audit
SKU-Level Profitability
Know exactly which products make money and which erode profit, down to fees, ads, COGS, and returns.
Trends Caught Early
Fee changes, cost increases, and profitability erosion surfaced before they compound.
Decisions, Not Just Reports
Every margin insight comes with context your Brand Manager can act on.
See what Lumian sees
Paste any ASIN. Our AI audits your listing in real time. No sign up required.
Titles, bullets, images, backend search terms, A9 indexing, Cosmo readiness, and Rufus optimization.
capabilities
Full scope of what Profitability covers.
P&L reconstruction, SKU-level margin analysis, fee reconciliation, and margin modeling.
Know Your Numbers
/
P&L Reconstruction
Full P&L Assembly: Revenue, fees, COGS, advertising, and net profit consolidated from Amazon reports, advertising console, and your cost data into one complete financial view.
Settlement Reconciliation: P&L reconciled against Amazon settlement reports to ensure every line item is accounted for.
Time-Series Tracking: P&L compared across custom time periods to spot fee increases, margin compression, and profitability trends early.
Key Metrics
Done
P&L Reports
View Reports
Reconciliation Done
Know What's Profitable
/
SKU-Level Profitability
SKU-Level P&L: True profitability calculated per product after all fees, ads, COGS, and returns are factored in.
Margin Driver Analysis: Products ranked by their contribution to total margin, surfacing the top performers and the bottom drags.
Per-SKU Action Plans: Each SKU tagged with a recommended action based on margin profile.
Ahoy Matey
United States
P&L comparison
Jan 2026
FEB 2026
Jan 2026
Analysis
Done
Fee
20 %
Margin Compression
5 %
Profitability
12 %
Contextualize changes
Done
Model What's Next
/
Margin Modeling
Scenario Planning: Profitability modeled for new products, fulfillment shifts (FBM to FBA, 1P to 3P), fee structure changes, and dimensional updates before committing.
Ad Spend & Margin Analysis: Variable advertising spend mapped against SKU-level margins to isolate where ad dollars protect profit and where they erode it.
Revenue & Profit Projections: Forward-looking margin projections modeled across growth scenarios, pricing changes, and cost shifts.
Scenario Planning
Done
Fulfillment Shifts
Fee Structure Changes
Dimensional Updates
Advertising Spend
SKU-level margins
Ahoy Matey
United States
Revenue Projections
Protect Your Margins
/
Fee Reconciliation
Fee Validation: Category, referral, and dimensional fees reviewed against expected rates to catch overcharges.
Chargeback & Dispute Filing: Incorrect chargebacks, fulfillment fee errors, and inbound receiving discrepancies identified and disputed.
Account-Level Reconciliation: All fees, adjustments, and reimbursements monitored and reconciled.
Current Fees
Category
$XXX
Referral
$XXX
Expected Fees
Category
$XXX
Referral
$XXX
Chargeback & Dispute
Done
Chargebacks
Incorrect
Fulfillment Fee
Error
Inbound Receiving
Error
Reconciliation
Done
How Profitability runs at Lumian.
AI tracks margins and flags shifts. Your finance team validates and models. Your Brand Manager recommends and acts. You make informed decisions on margin.
Book a Strategy Call
ALWAYS ON
Fee Monitoring
Fees audited against expected rates, chargebacks and discrepancies flagged, reimbursements tracked.
daily case
P&L & SKU Profitability Review
Full P&L reviewed, per-SKU margins analyzed, top performers and bottom drags identified. Margin trends, fee changes, and cost shifts presented.
Marcus Liu
Content Specialist
on demand
Margin Modeling
Scenario analysis for new products, fulfillment shifts, pricing changes, and ad spend impact run whenever strategic decisions need backing.
Marc Raymonds
Brand Manger
AI Agent
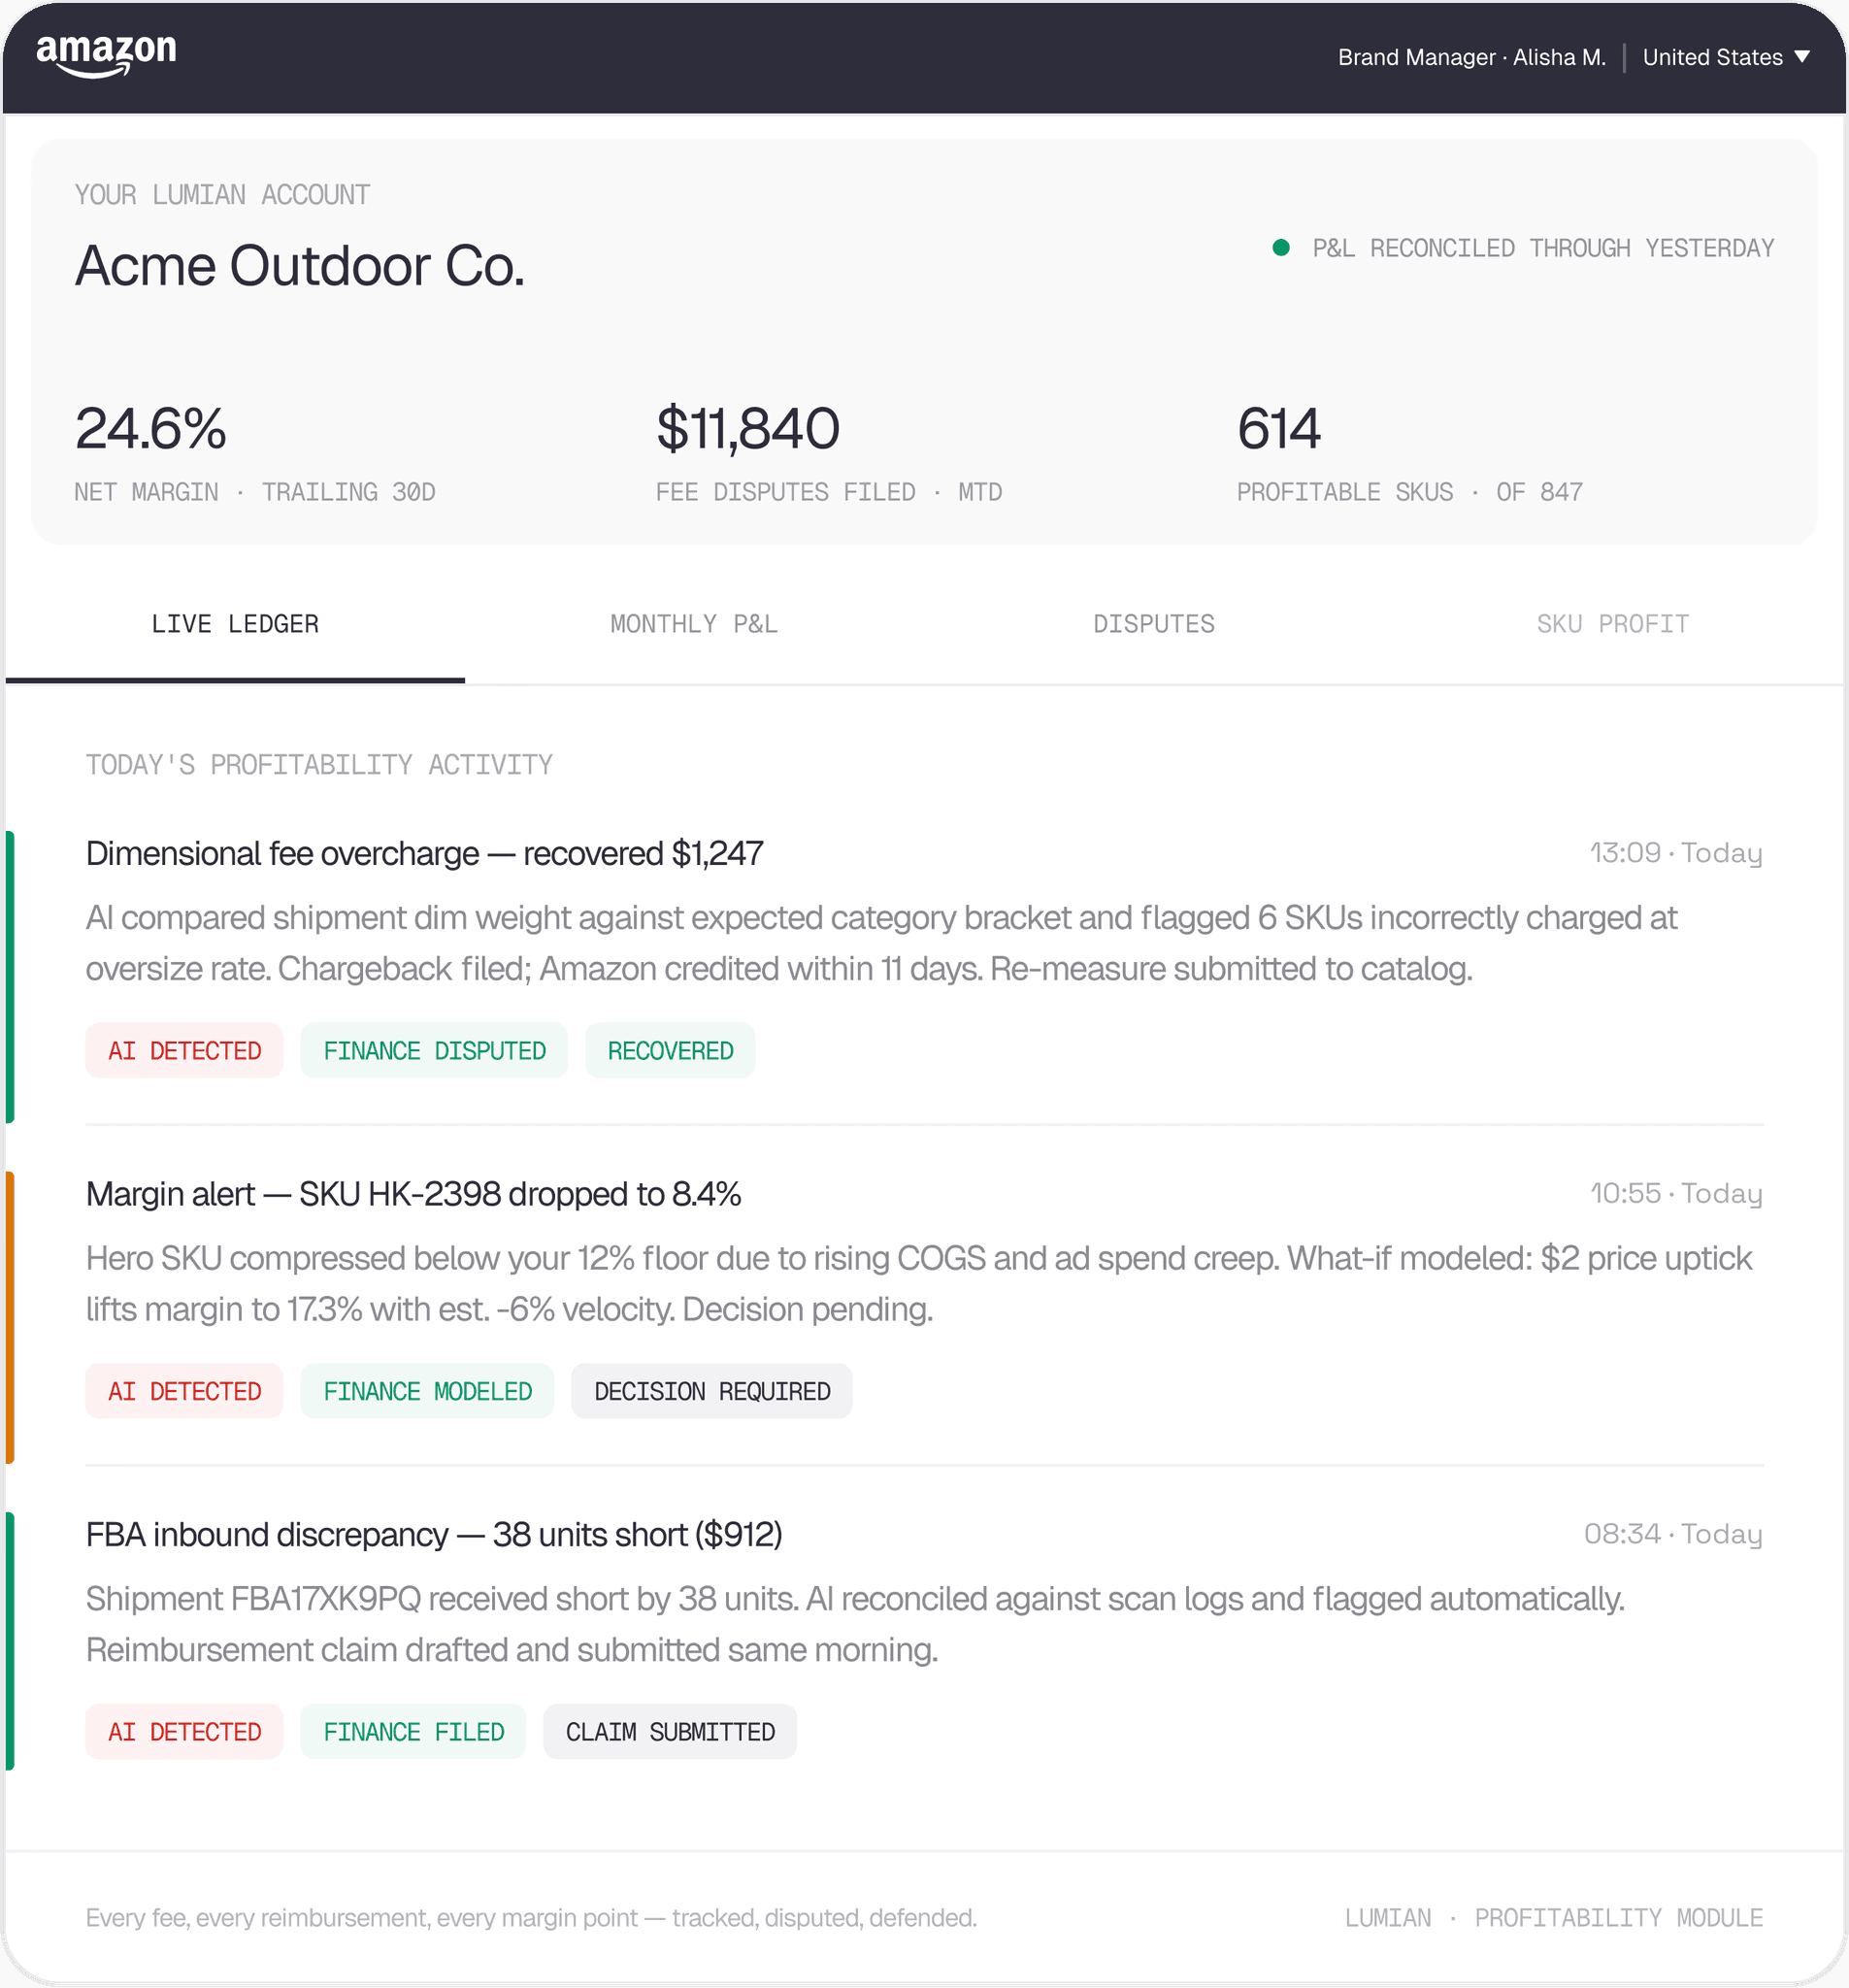



The onboarding journey
Amazon, finally off your plate.
Common questions
Everything you want to know before the call.
What does Lumian's Profitability service cover?
P&L reconstruction, SKU-level margin analysis, fee reconciliation, and margin modeling, managed by AI agents and our finance team, overseen by your Brand Manager. Every insight is designed to inform decisions on pricing, advertising, inventory, and which SKUs to invest in or phase out.
Can Lumian identify Amazon fees that are hurting margin?
Can Lumian show which SKUs are driving profit and which are not?
Do you reconcile against Amazon settlement reports?
How does Lumian track profitability over time?
Who interprets the financial data and recommends actions?
AI Agent
Your Amazon business, fully managed.
Brand ManAger
Expert Team